DETAILED TESTING OF GRAFEX® SUPER [C-60] ACTIVATED CARBON FULLERENES
To date, over 600 analyses and tests have been performed in a diverse grouping of private, government and university laboratories across the nation.
Our Research
Many of these include nanoresearchlabsthat bring to bear highly sophisticatedequipment and techniques for identificationand verifying the properties, purityandstructuralfeaturesof the Grafex®Super [C-60] activated carbon fullerene material. Such characterization proceeded during a rapid advancement of the new and growing field of nano technology. Grafex®Super [C-60]material has been described, by a number of researchers, as a veryunique allotropeof activated carbon. Research and development efforts in the manufacturing,characterizationand product application of this material have led to numerous intriguing discoveries.
Grafex® Super [C-60]’shigh content ofcrystalline graphitic carbonphase has been verified in many different ways. Only a small sampling of thosetests , dealing with supplementalrejuvenational health, safety, quality and consistency, are being presented on this website. Equipping a University Laboratory with such rapidlychanging instrumentation was so staggering in costs in the early days of Grafex®Super [C-60] that only a handful of Universities possessed even rudimentary equipment. Now, well over a hundred Laboratories across the nation have arisen and are growing with quite advanced/sophisticated equipment costing as much as $15,000,000 per Laboratory. Some namesof the equipment, testing tools and techniques utilized for identifyingthe various characteristics of Grafex® Super [C-60]fullerene molecules and the illuminating data therefrom are displayed below:
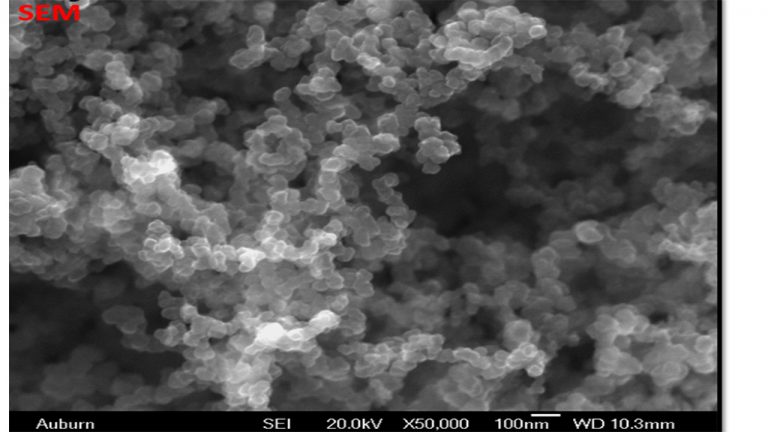
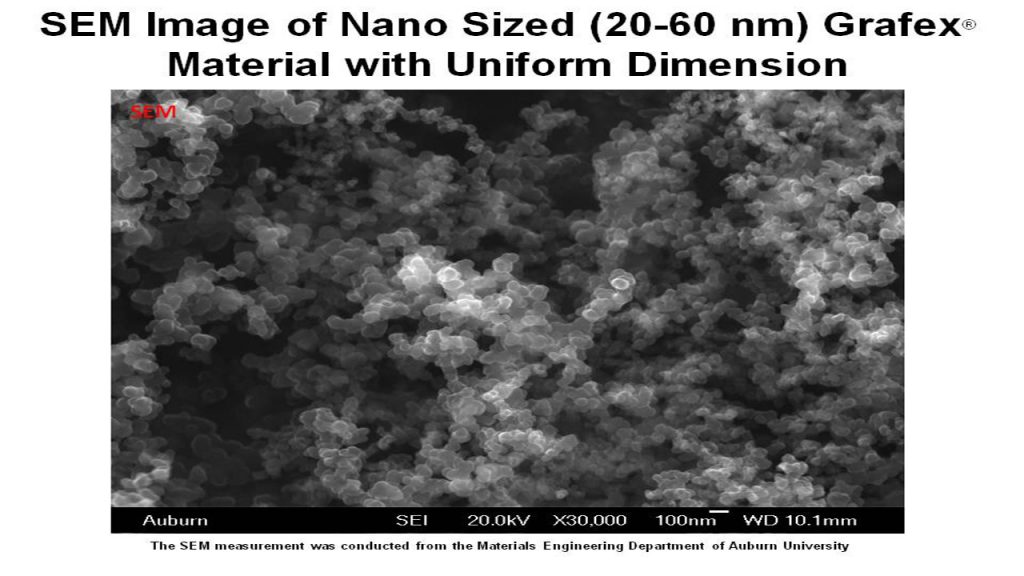
FE-SEM – Field Emission Scanning Electron Microscopy is used in visualizing overall structure of nanocarbon, including graphitic character. While TEM will provide higher resolution images, FE-SEM is generally more approachable and affordable.
SEM Image of Nano Sized (20-60 nm) Grafex® Material with Uniform Dimension
The SEM measurement was conducted from the materials engineering department of Auburn University
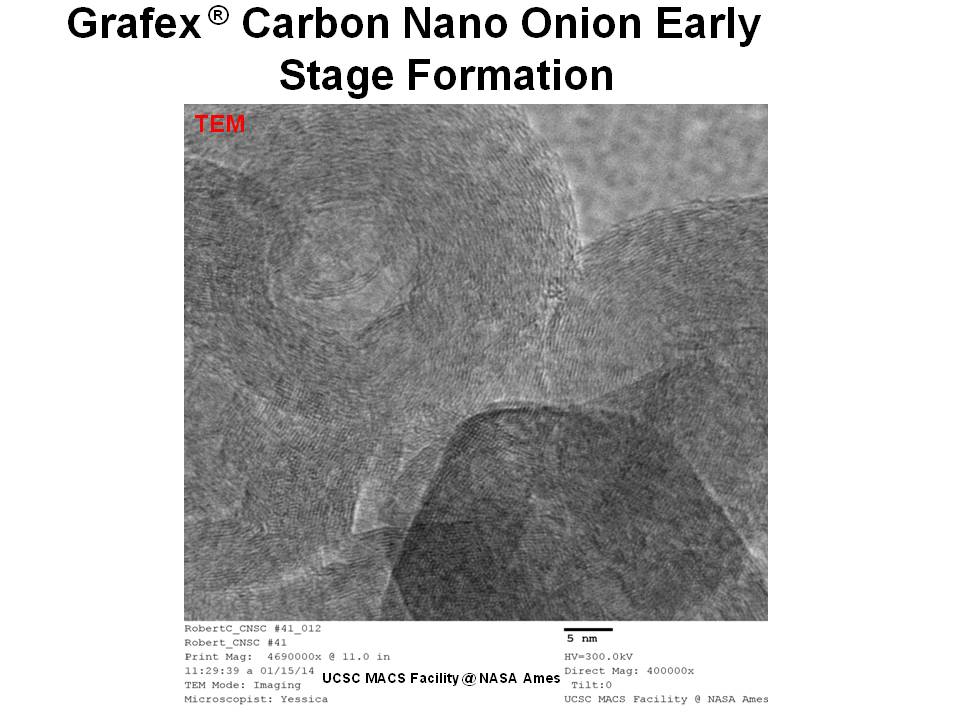
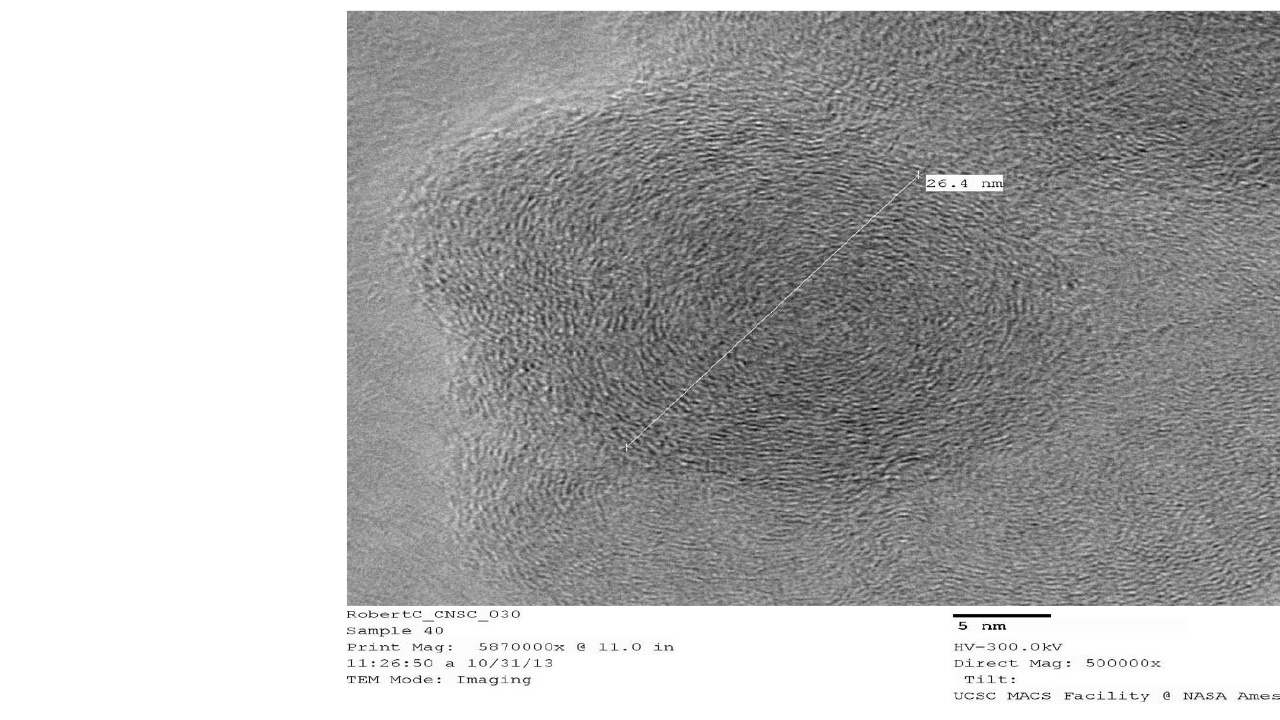
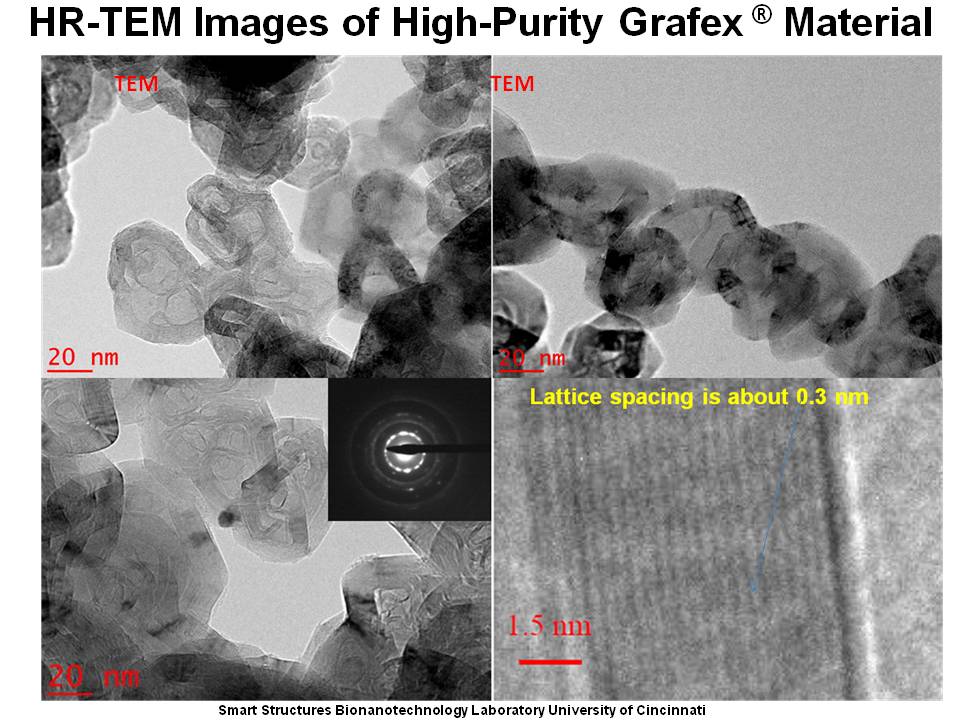
HR-TEM – High Resolution Transmission Electron Microscopy provides images of nanocarbon structures to 1 million times magnification, and sub nanometer resolution. TEM provides easy to interpret structural information, such as orientation of graphitic planes. TEM is used in with Raman spectroscopy and XRD as a method to show degree of graphitization, i.e. graphitic character.
GC – Gas chromatography is used in analytical chemistry for separating an analyzing compounds that can be vaporized without decomposition. Typical uses of GC include testing the purity of a particular substance, or separating the different components of a mixture.
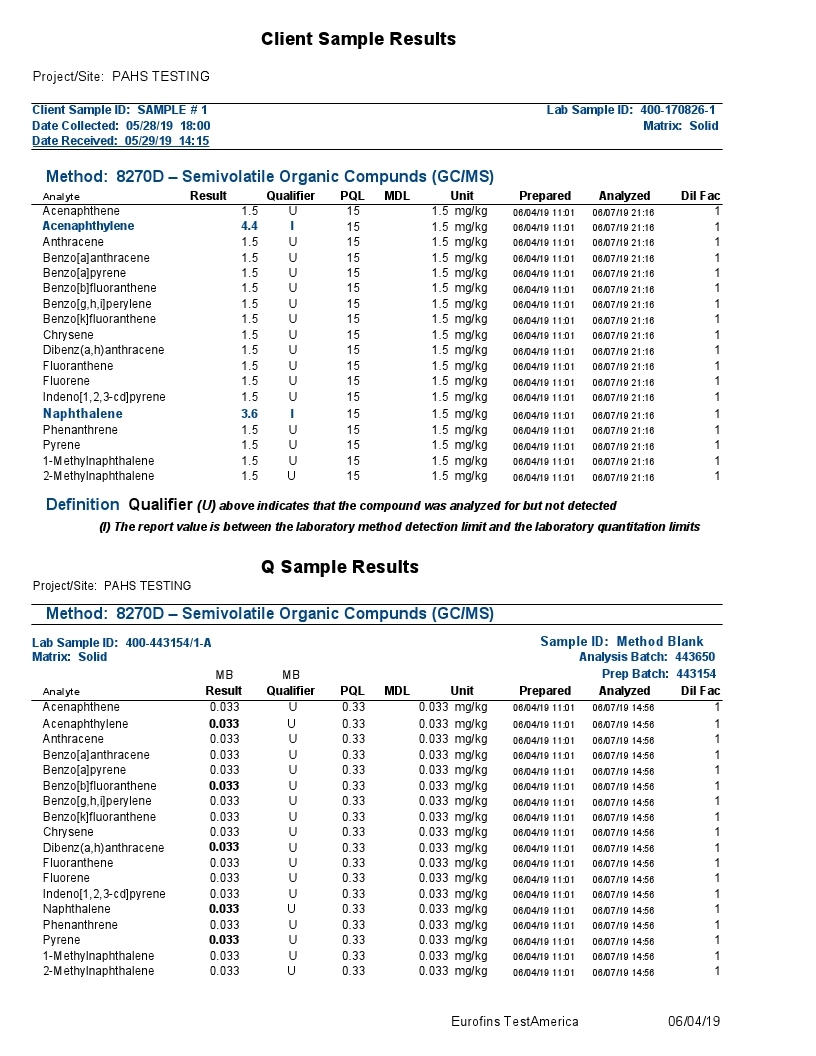
The combination ofGas Chromatography(GC) andMass Spectrometry(MS) is an invaluable tool in the identification of Polycyclic Aromatic Hydrocarbons (PAHs) which are a group of over 100 different chemical molecules. Below is testing of the Grafex material by a commercial testing lab called Eurofins Test/America, to determine to what extent, if any, that the Grafex material may have PAHs.
Gas Chromatography(GC)
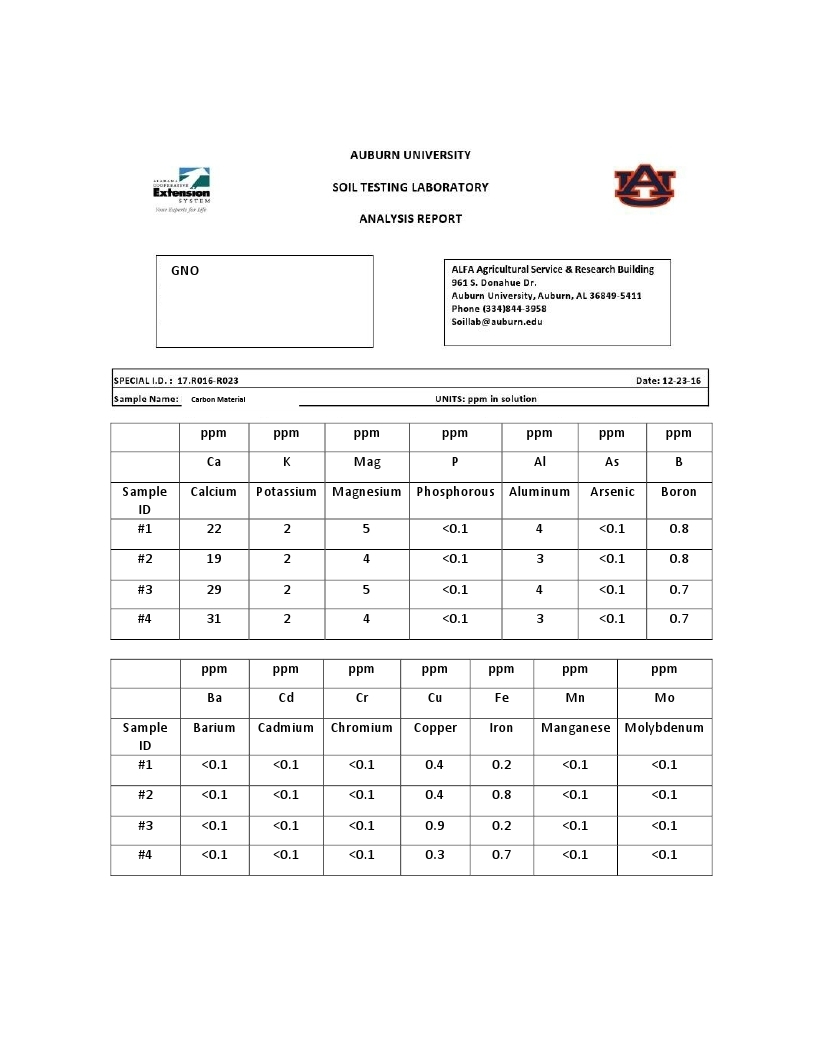
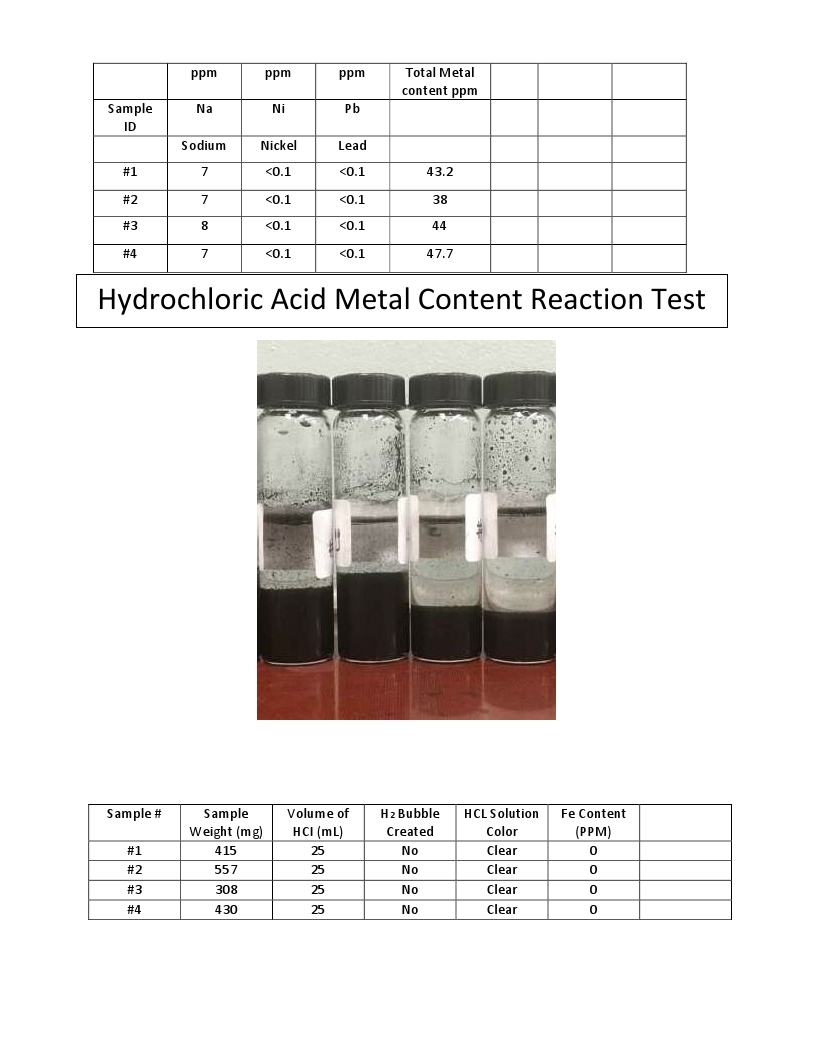
ICP-MS – Inductively Coupled Plasma Spectroscopy is an important method for analyzing residual inorganic constituents in nanocarbon, e.g., mineral residue, trace metals, and ionic contamination. The presence of inorganic materials can adversely impact the biomedical and electrical performance of nanocarbon materials. Below is testing of the Grafex material by Eurofins TestAmerica Labs.
Mass Spectrometry(MS)
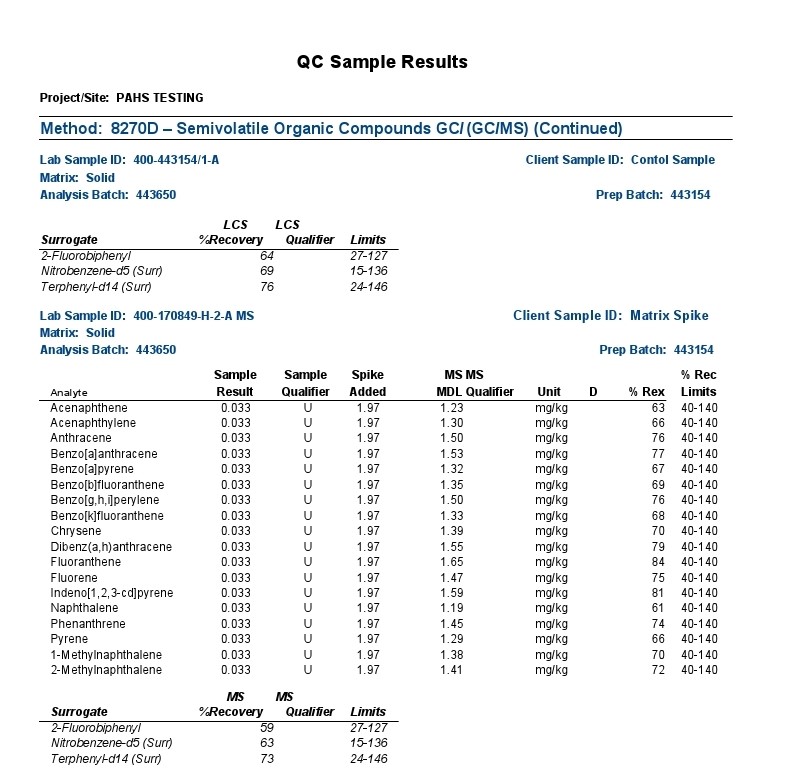
The polycyclic aromatic hydrocarbons (PAHs) listed above were the focus of a most rigorous and reproducible analysis by a certified laboratory, strictly following standardized testing protocols.
Definition Qualifier: As with most any sophisticated instrumentation, electronic detection of a signal is required against a baseline signal often characterized as electronic noise. In the above report, the background noise is insufficiently resolved from a true signal with most signals presented as undetectable (“U”) at the 1.5 ppm MDL (Method Detection Limit); the 4.4 & 3.6 ppm results for acenaphthalene and naphthalene respectively are presented with an “I” designation suggesting also poor distinction from background electronicnoise and the laboratory practical quantification limit (limitations associated with the laboratory analytical sample preparation).Note: (The maximum U.S. government regulation limit on acenaphthalene in residential areas is 2400 ppm; the maximum limit on naphthalene in a residual area is 554 ppm).
Since its discovery at Rice University in 1985, C60 fullerene has been found to accompany the formation of soot that likewise often bears polycyclic aromatic hydrocarbons (PAHs) of a generally perceived unhealthful nature or amount.
Accordingly, a lengthy list of PAHs provided in the above gc-ms analytical report were evaluated for presence in the Grafex® Super [C-60] by a highly reputable certified laboratory utilizing a most rigorous and reproducible procedure following well-established standardized testing protocols
Analysis by gc-ms involves the separation and resolution of the various PAH components utilizing a specialized capillary tube a third of a football field in length (30 meters). As each resolved component exits the gas chromatograph (gc) column or capillary tube, it is ionized via a mass spectrometric (ms) hookup and detected electronicall
So, all results are tied to an electronic signal in separable and indistinguishable beyond the electrical noise of the instrumentation and/or the reproducibility of analytical sample preparations according to the labels “U” and “I” explained by the testing company
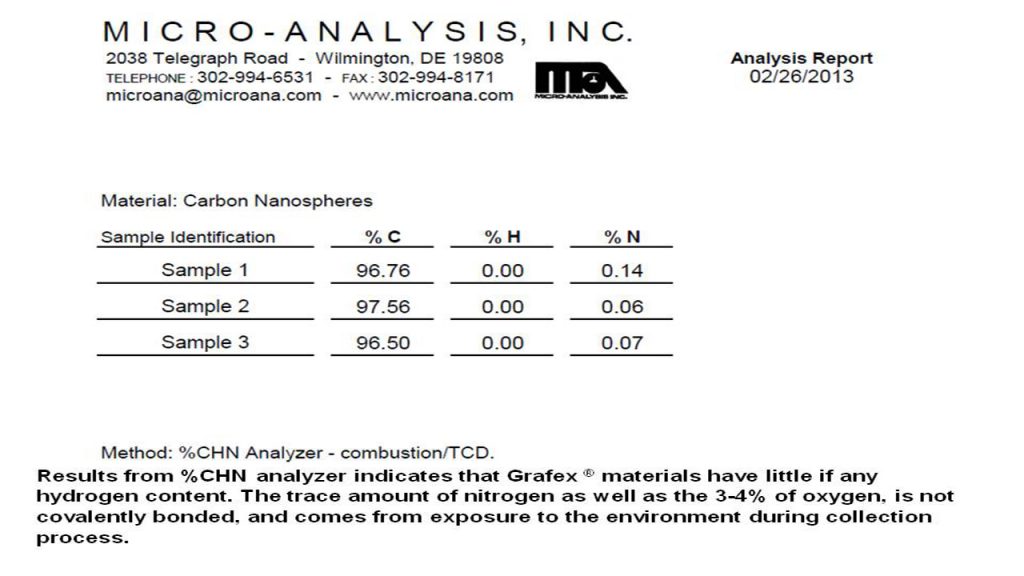
Accordingly, no measurable PAH content in the nanocarbon material was detected in the low ppm limits of the analytical procedure. These results correspond with the CHN analysis also provided at this website from Micro-Analysis, Inc. where no hydrogen content was detected thereby likewise confirming that no PAH content is detectable.
GDMS is the preferred analytical technique for the certification of high purity materials such as used in the semiconductor industry. Analogous to inductively coupled plasma mass spectrometry (ICPMS), differences exist in the types of mass analyzers used in GDMS, which have a direct bearing on the respective analytical characteristics, applications, and costs.
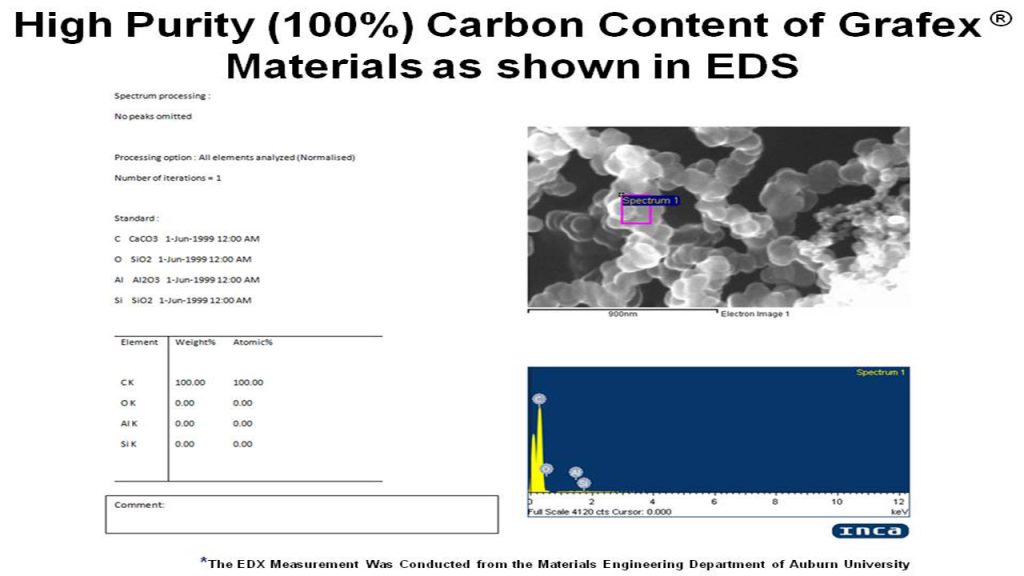
EDS – Energy Dispersive X-Ray Spectrometer (herein below abbreviated to EDS), is often used by combining it with an electron microscope (including a transmission electron microscope, a scanning electron microscope, etc.) for the purpose of conducting elemental analysis of a specimen or sample of nano carbon.
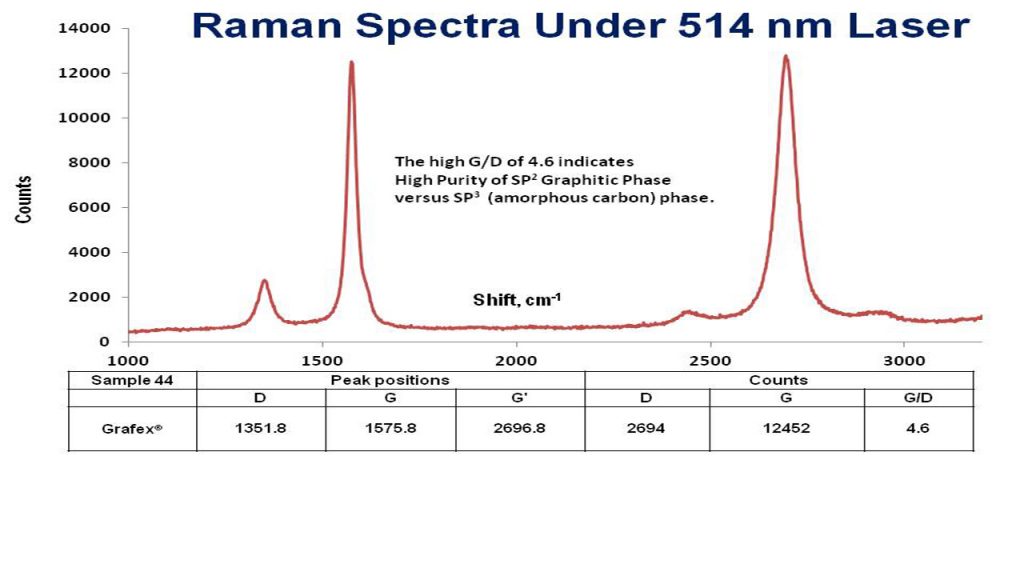
RamanSpectroscopy – Raman is used to determine structural information, such as the degree of graphitic character, and coupled with TEM and XRD, is the best approach to characterizing the structure of graphitic nanocarbon material. Raman spectroscopy can also be used for calculating the density of states inferring the structure of the conduction band.
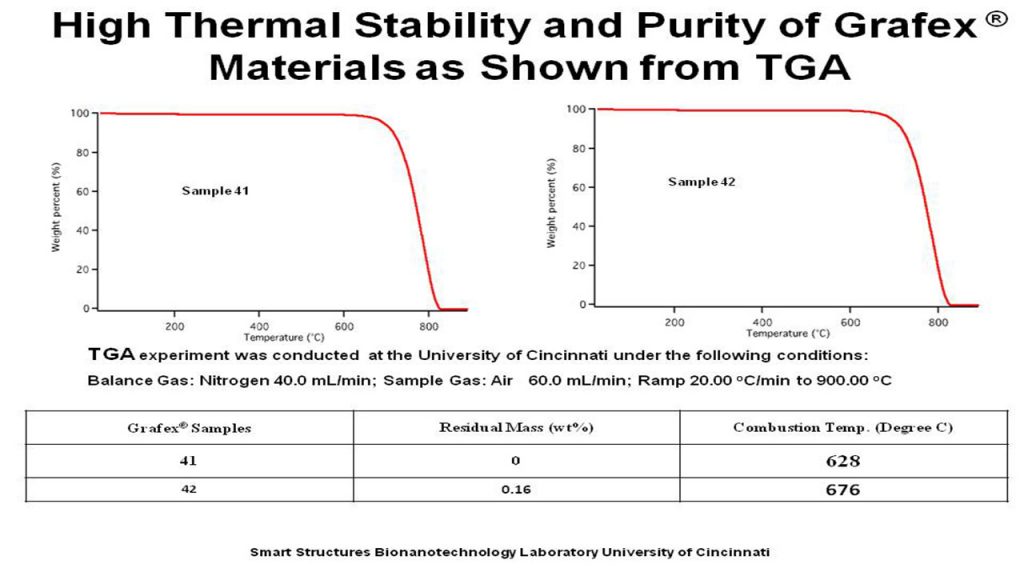
TGA/DSC – Thermal Gravimetric Analysis/Differential Scanning Calorimetry is a measure of the structural integrityof large nanocarbon materials. TGA transition values of less than 400 degrees Celsius suggest a more amorphous character, and transition temperatures above 450 degrees Celsius, more graphitic character.
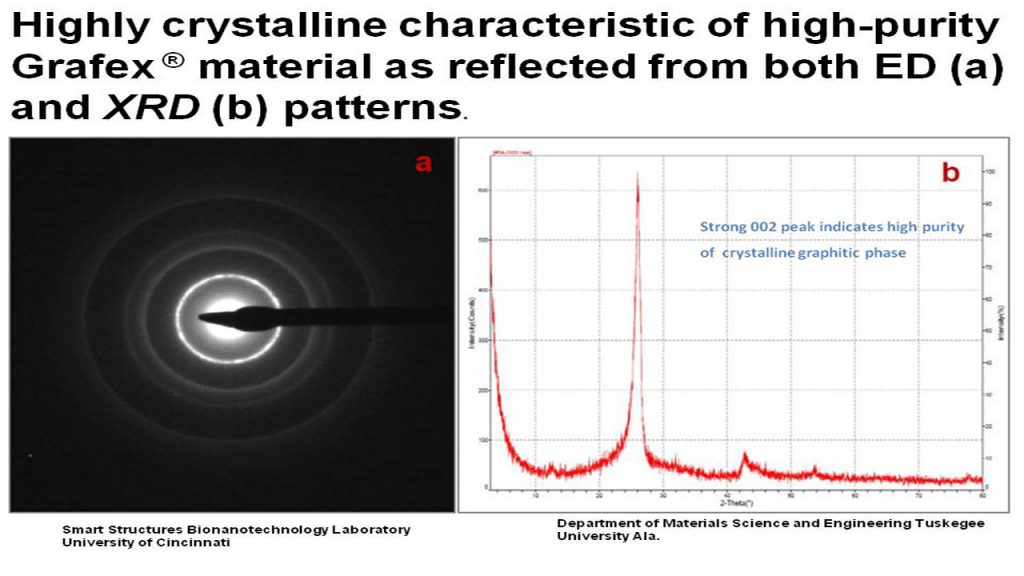
ED – Electron diffraction is most frequently used in solid state physics and chemistry to study the crystal structure of solids. Experiments are usually performed in conjunction with a transmission electron microscope (TEM), or a scanning electron microscope (SEM) as electron backscatter diffraction.
XRD– X-Ray Diffraction provides information about structure and especially orientation of graphitic planes, and hence a good approach to determining graphitic character. XRDis a very good tool for comparingdegree of graphitization between graphiticmaterials prepared by various techniques.
ESR/EPR –Electron Spin Resonance is a sensitive tool providing information about electrical conductivity, including conduction in 2D planes as well as 3D directionality, which is important for characterization of polyhedral carbons. ESR will also yield information about dangling bonds, surface electron numbers and activity, which is another figure of merit in determining the degree of surface activity.
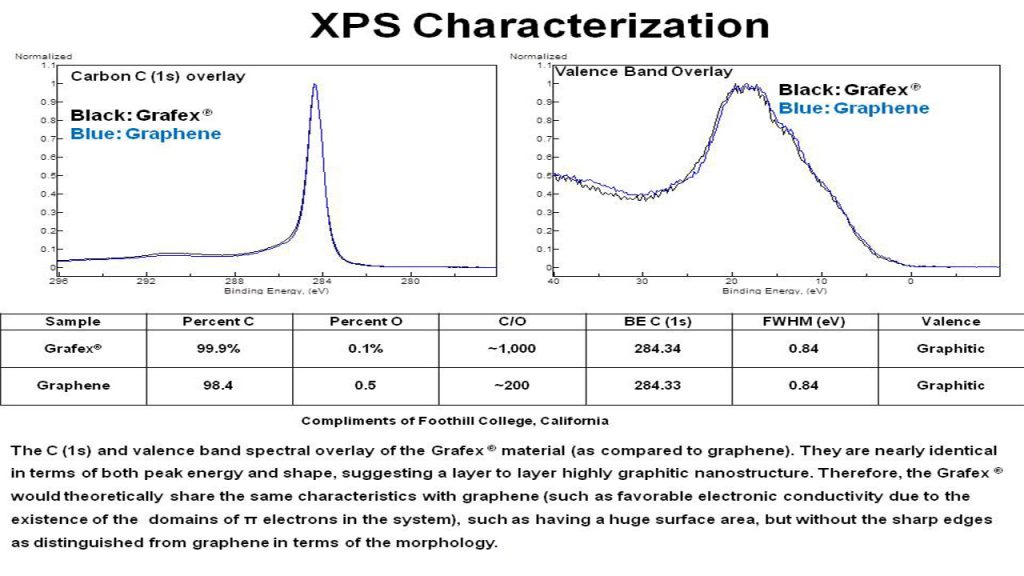
XPS –X-Ray Photoelectron Spectroscopy is a surface sensitive tool which provides both elemental compositions, as well as chemical bonding information. It is sensitive to all elements (Z number greater than hydrogen) and is a good measure of oxidation, as well as inorganic residues at 0.5 atom % or greater. Based on the shape of the carbon C (1s) peak, the degree of graphitic character can be inferred.
CHN – Carbon Hydrogen Nitrogen Analysis – CHN analysis is an older technique practice for decades but not well known in the practice of nanocarbon engineering. It’s primary purpose for nanocarbon analysis is for determining residual hydrogen and occasionally oxygen by difference.
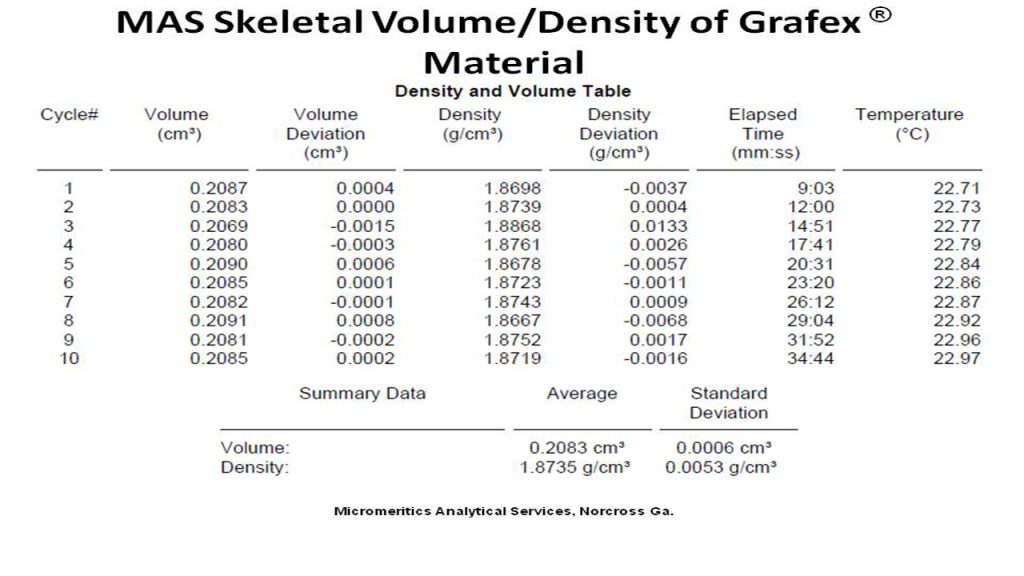
Density –Density of nanocarbon is important as a measure of consistency in both graphitic character as well as the micro/macro structure of nanocarbon chains. It should be done carefully with a sensitive balance in order to provide a degree of precision for lot to lot comparison.
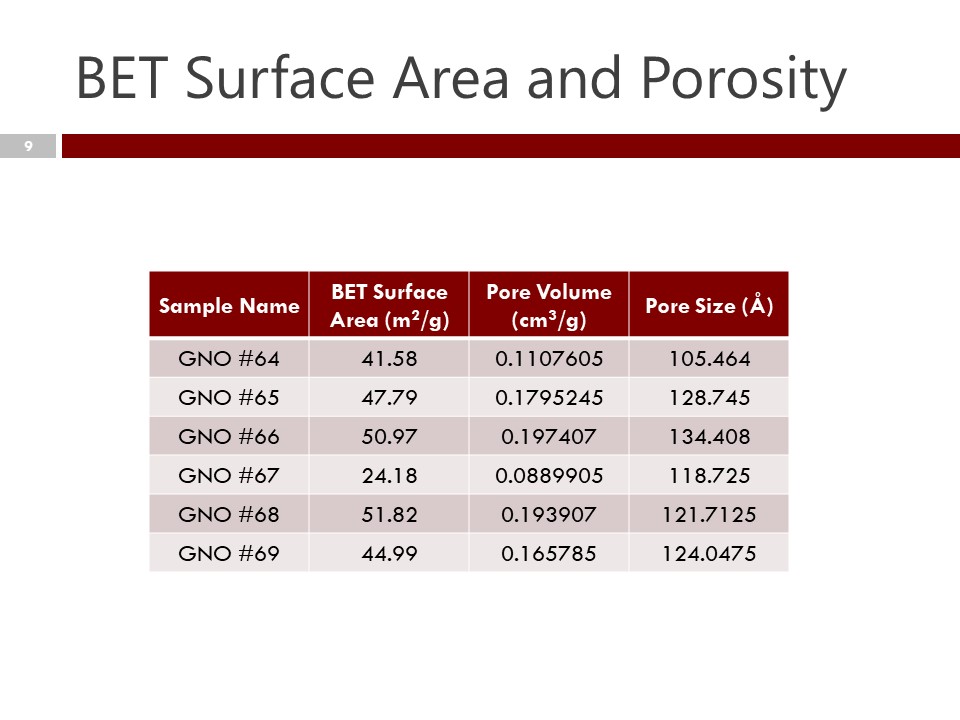
BET – Surface Area measurements – are an important measure of the surface area of nanocarbon, and an important differentiator in physical properties, especially prediction of surface area and cohesion for polymer-composite bonding.